


Boston Condominium Market Report: August 2024 - February 2025

Charles King
Charles King is a top-producing real estate agent in Hingham, MA and a trusted Realtor serving the South Shore of Massachusetts, including Hanover, Hu...
Charles King is a top-producing real estate agent in Hingham, MA and a trusted Realtor serving the South Shore of Massachusetts, including Hanover, Hu...
The Boston condominium market has been buzzing with activity over the past six months, showing a dynamic range of pricing, sales volume, and time on the market across different neighborhoods. Whether you're a buyer, seller, or investor, understanding the latest trends can help you make informed decisions. Below, we break down the latest statistics from August 11, 2024, to February 11, 2025, to give you a clearer picture of the Boston real estate landscape.
Key Highlights from the Report
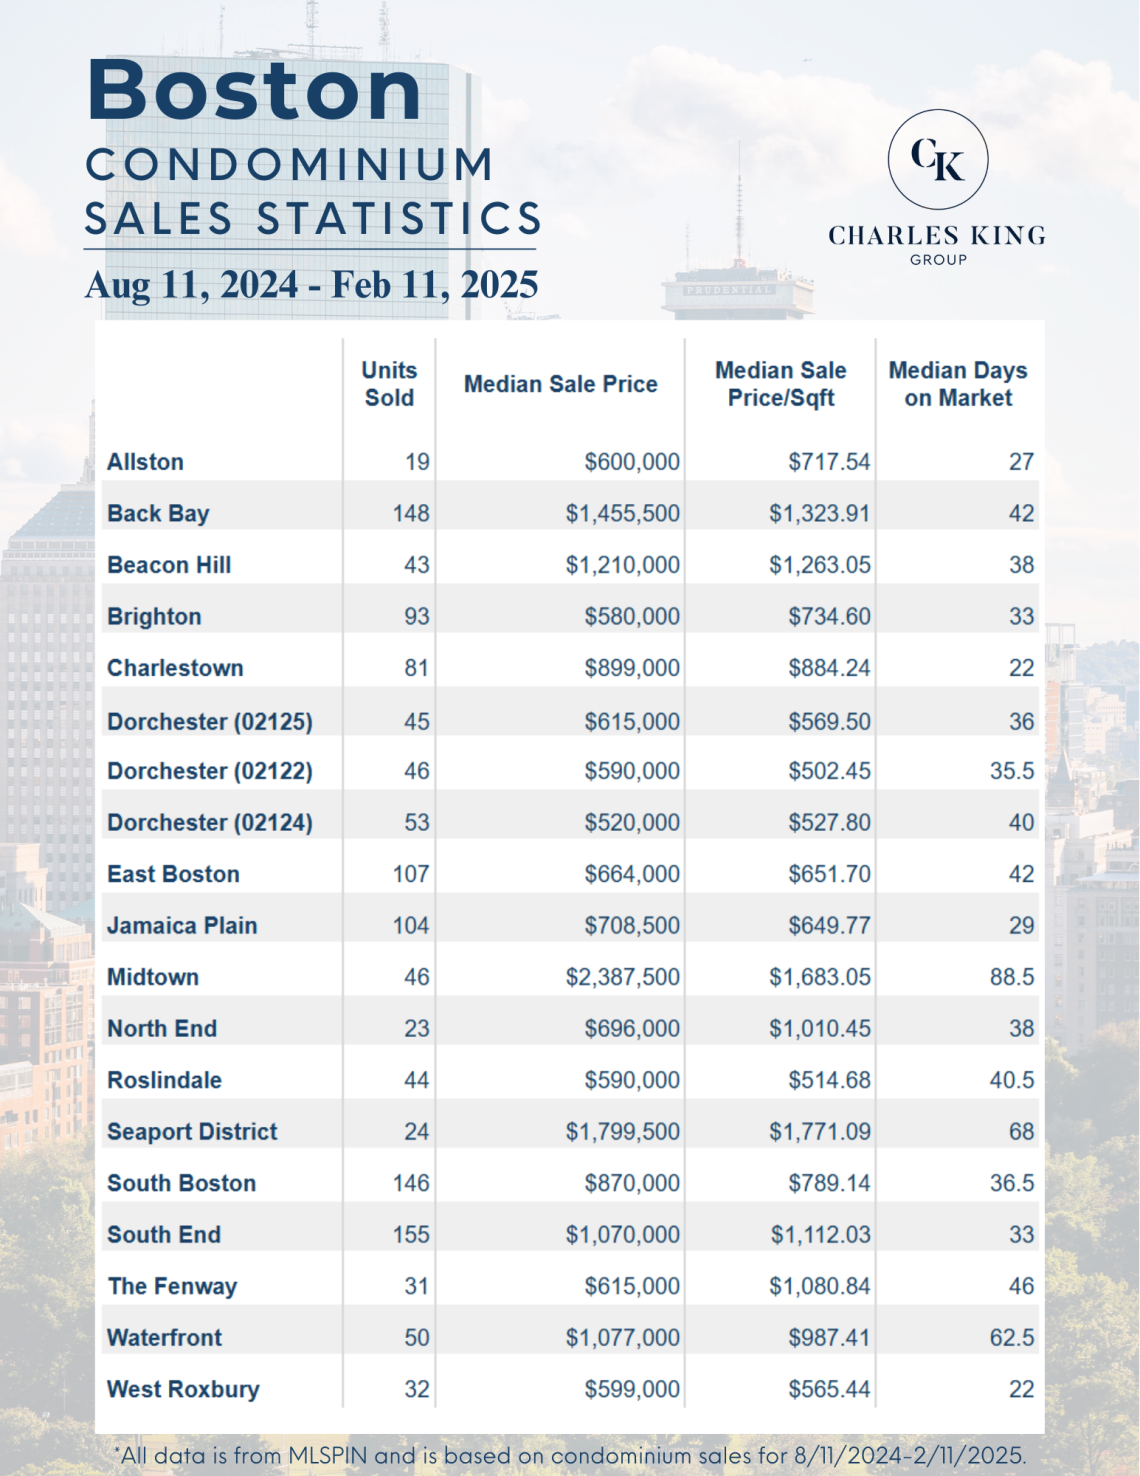
Back Bay Leads in Sales Volume: With 148 units sold, Back Bay remains one of Boston's hottest condo markets, boasting a median sale price of $1,455,500 and a price per square foot of $1,323.91.
Midtown Tops the Luxury Market: Midtown saw the highest median sale price at $2,387,500, along with the highest price per square foot at $1,683.05. However, condos in this area also had one of the longest median days on the market at 88.5 days.
Affordability in Dorchester and Roslindale: Dorchester (02124) had one of the lowest median sale prices at $520,000, with a median price per square foot of $527.80. Roslindale also offered more affordable options, with a median sale price of $590,000 and a price per square foot of $514.68.
Fastest-Selling Market: West Roxbury had the shortest median days on the market at just 22 days, indicating strong demand and a competitive market for buyers.
Seaport District Commands Premium Prices: Seaport continues to be one of the most expensive areas, with a median sale price of $1,799,500 and the highest price per square foot at $1,771.09.
Boston Condo Market Breakdown by Neighborhood
Luxury Neighborhoods ($1M+ Median Sale Price)
Back Bay: $1,455,500 | $1,323.91 per sqft | 42 days on market
Beacon Hill: $1,210,000 | $1,263.05 per sqft | 38 days on market
Midtown: $2,387,500 | $1,683.05 per sqft | 88.5 days on market
Seaport District: $1,799,500 | $1,771.09 per sqft | 68 days on market
South End: $1,070,000 | $1,112.03 per sqft | 33 days on market
Waterfront: $1,077,000 | $987.41 per sqft | 62.5 days on market
Mid-Tier Neighborhoods ($600K - $1M Median Sale Price)
Charlestown: $899,000 | $884.24 per sqft | 30 days on market
East Boston: $664,000 | $651.42 per sqft | 42 days on market
Jamaica Plain: $708,500 | $649.77 per sqft | 29 days on market
North End: $696,000 | $1,010.45 per sqft | 38 days on market
South Boston: $870,000 | $789.14 per sqft | 36.5 days on market
Affordable Neighborhoods (Sub-$600K Median Sale Price)
Allston: $600,000 | $717.54 per sqft | 27 days on market
Brighton: $580,000 | $734.60 per sqft | 42 days on market
Dorchester (02125): $615,000 | $569.50 per sqft | 36 days on market
Dorchester (02122): $590,000 | $502.45 per sqft | 35.5 days on market
Dorchester (02124): $520,000 | $527.80 per sqft | 40 days on market
Roslindale: $590,000 | $514.68 per sqft | 40.5 days on market
The Fenway: $615,000 | $1,080.84 per sqft | 46 days on market
West Roxbury: $599,000 | $565.44 per sqft | 22 days on market
Market Trends and Takeaways
Luxury Market Performance: High-end neighborhoods like Midtown, Seaport, and Back Bay continue to dominate with steep prices, but longer days on the market suggest a more selective buyer pool.
Competitive Affordable Markets: Lower-priced neighborhoods such as West Roxbury and Roslindale are seeing quick sales, indicating high demand for affordable housing options.
Investment Opportunities: Areas like East Boston and South Boston, which offer mid-tier pricing with relatively fast sales, may be ideal for investment potential.
Price Per Square Foot Disparities: The price per square foot varies significantly across neighborhoods, making it crucial for buyers and sellers to understand the value of their investment.
Looking Ahead
As we move into the spring and summer of 2025, we anticipate continued demand in key neighborhoods, particularly for mid-tier and affordable housing options. Luxury markets may experience longer listing times but will likely maintain their high value. Whether you're buying or selling, having the right real estate team on your side is essential to navigating this competitive market.
For personalized advice on buying or selling a Boston condo, contact Charles King Group today. We specialize in helping clients make the most informed real estate decisions across Eastern Massachusetts.
Data Source: MLS PIN (Massachusetts MLS Property Information Network), covering sales from August 11, 2024, to February 11, 2025.
Stay tuned for our next market update as we track trends into the spring and summer months!
Selling Your Home?
Get your home's value - our custom reports include accurate and up to date information.