


Boston Condo Sales Statistics (Oct 2023 - April 2024)

Charles King
Charles King is a top-producing real estate agent in Hingham, MA and a trusted Realtor serving the South Shore of Massachusetts, including Hanover, Hu...
Charles King is a top-producing real estate agent in Hingham, MA and a trusted Realtor serving the South Shore of Massachusetts, including Hanover, Hu...
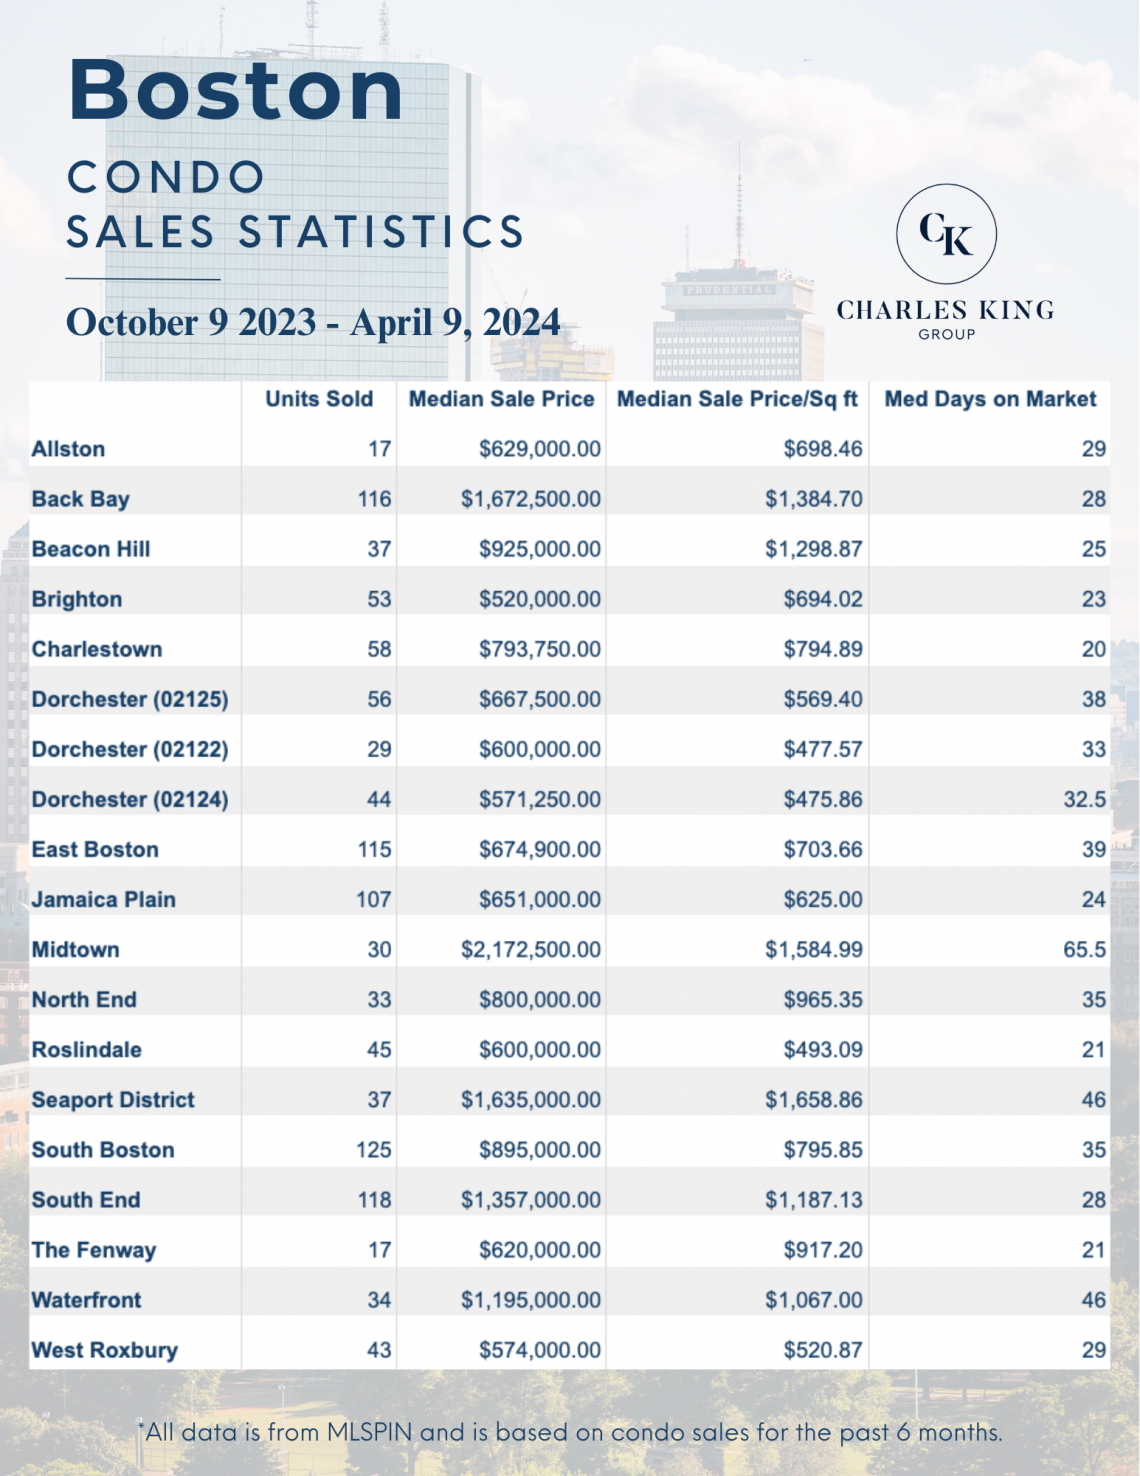
The Boston condo real estate market presents a diverse range of investment opportunities, with a clear distinction in median sale prices and price per square foot between waterfront and non-waterfront neighborhoods for the period of October 9, 2023, to April 9, 2024.
**Waterfront Neighborhoods:**
- Among the waterfront neighborhoods, the Seaport District emerges as the priciest with a median sale price of $1,635,000 and the highest price per square foot at $1,658.86, reflecting its high-demand luxury market. The Seaport District also shows a longer median time on the market of 46 days, which could suggest a premium market with less turnover.
- East Boston and Dorchester appear to be the most affordable waterfront neighborhoods, with a median sale price of $674,900 and $600,000 respectively. East Boston's price per square foot is $703.66 so if you're flexible on location Dorchester's $477.57/sq ft might be more appealing.
- Notably, the North End has a considerable median sale price of $800,000 but stands out with the highest median sale price per square foot of $965.35 after the Seaport District.
- The Waterfront area showcases a median sale price of $1,195,000 with a median sale price per square foot of $1,067.00 and shares the longest median days on the market with the Seaport District at 46 days.
- South Boston comes in with the highest number of units sold (125) in all waterfront neighborhoods.
**Non-Waterfront Neighborhoods:**
- Midtown is the most expensive non-waterfront neighborhood with a median sale price of $2,172,500 and the highest price per square foot at $1,584.99, indicating a luxury market presence.
- In contrast, Brighton offers the most affordable options among the non-waterfront neighborhoods, with a median sale price of $520,000 and a median price per square foot of $694.02.
- Roslindale presents itself as a faster-moving market with the shortest median time on the market of 21 days, shared with The Fenway, indicating a quick turnover and potential high demand for condos in these areas.
Overall, the market statistics indicate that while waterfront neighborhoods offer prestigious and higher-priced condos, there are still relatively affordable options available. Non-waterfront neighborhoods show a wide range of pricing, with Midtown at the top end of the market and Brighton as a more budget-friendly choice. The days on the market for both waterfront and non-waterfront areas exhibit variability, with some neighborhoods showing rapid sales and others, like the Seaport District and Waterfront, indicating a more exclusive market with longer sale periods.
Selling Your Home?
Get your home's value - our custom reports include accurate and up to date information.