



Boston Condo Market Report — October 2026

Charles King
Charles King is a top-producing real estate agent in Hingham, MA and a trusted Realtor serving the South Shore of Massachusetts, including Hanover, Hu...
Charles King is a top-producing real estate agent in Hingham, MA and a trusted Realtor serving the South Shore of Massachusetts, including Hanover, Hu...
Boston Condo Market Report — October 2026 | Back Bay, South End, Beacon Hill & More
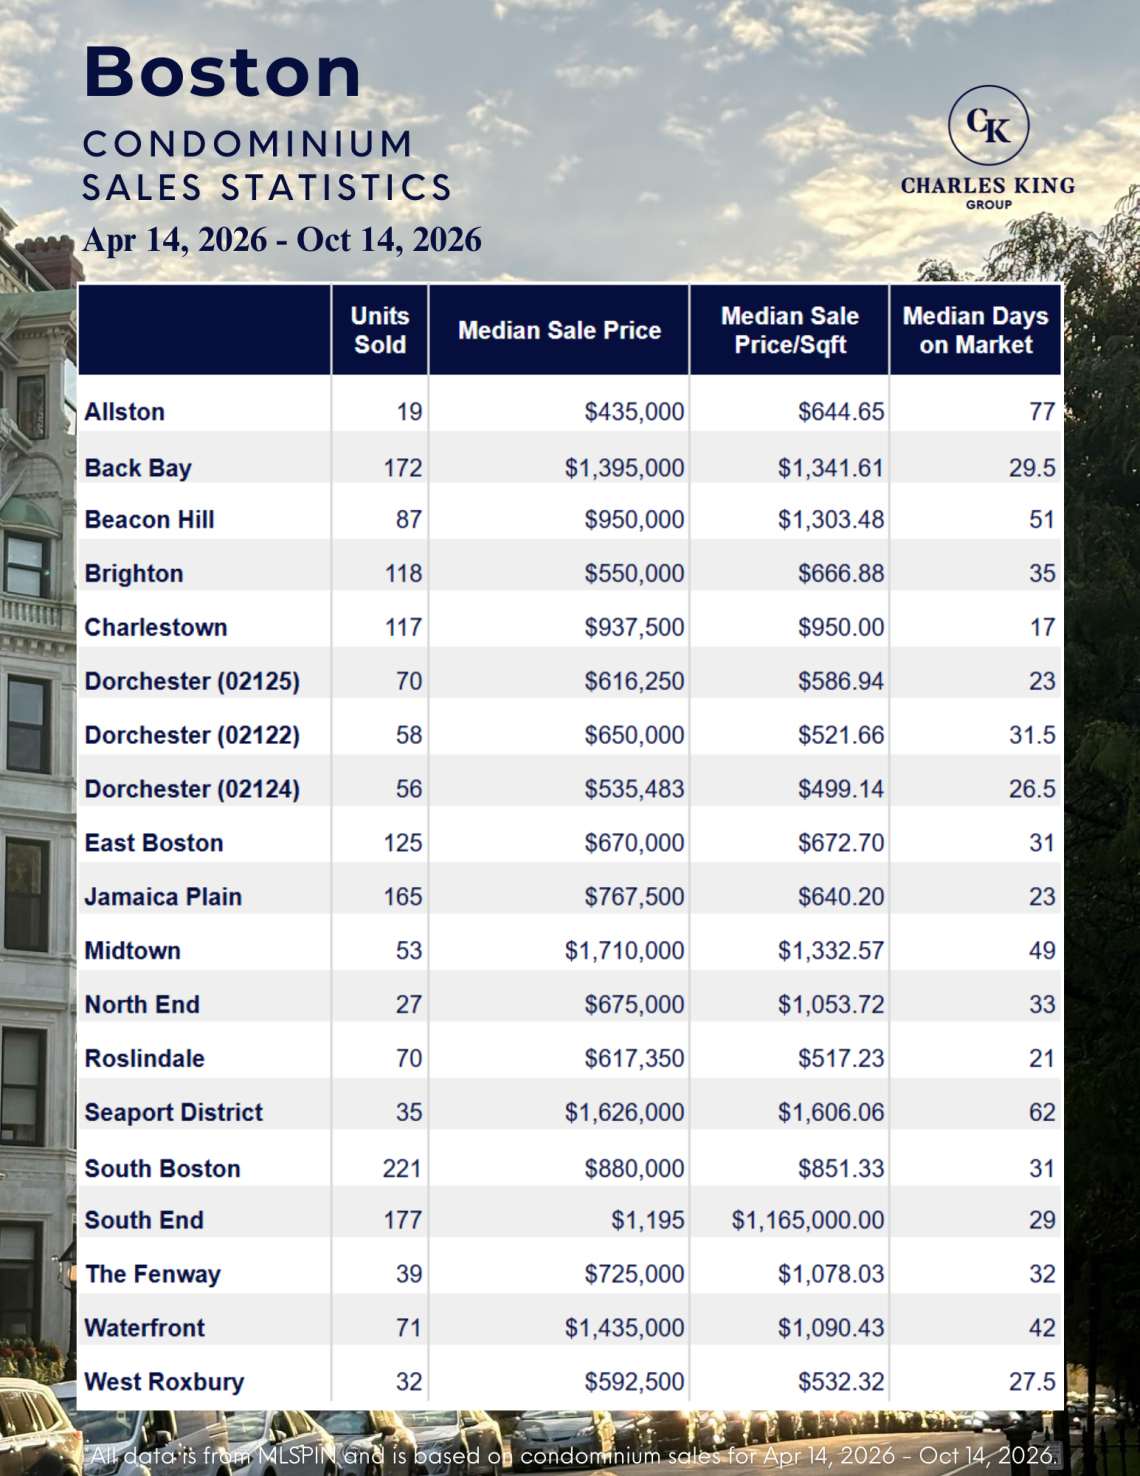
Published: October 14, 2026 | Data Period: April 14 – October 14, 2026 | Source: MLSPIN
The Boston condo market is humming along at a steady clip. Whether you’re watching Back Bay’s perennial strength, tracking Charlestown’s lightning-fast sales cycle, or eyeing the Seaport’s premium positioning, this six-month snapshot tells a clear story: location, price point, and speed to sale are tightly interwoven in Boston’s neighborhoods.
The Headline Numbers
- Highest median price: Seaport District at $1,626,000 | Waterfront premium in full effect
- Fastest-selling neighborhood: Charlestown at 17 days on market | Shortest cycle in the city
- Most volume: Back Bay with 172 units sold | Urban demand concentrated
- Back Bay median price: $1,395,000 | $1,341.61 per square foot
- South End median price: $1,195,000 | 29 days on market
- Total units sold across all neighborhoods: 1,668 condos (April–October 2026)
What Stands Out — and What It Means
Back Bay remains the volume leader. With 172 units sold over six months, Back Bay’s consistent transaction flow reflects both buyer demand and steady inventory. At $1,395,000 median price and just 29.5 days on market, this neighborhood continues to define the premium urban condo standard. What it means: If you’re selling in Back Bay, expect professional competition and knowledgeable buyers. If you’re buying, come prepared with financing pre-approval and realistic expectations about price-per-square-foot.
Charlestown’s speed is striking. Seventeen days on market is the fastest cycle in the entire region. Combined with 117 units sold and a $937,500 median, Charlestown is the neighborhood where supply, demand, and buyer enthusiasm align perfectly. Townhouse-style condos and the neighborhood’s walkability are clear draws. What it means: Sellers benefit from a compressed sales timeline and motivated buyers; inventory moves fast here. Buyers face competitive bidding and less time to deliberate.
The Seaport is claiming premium pricing — but with a caveat. At $1,626,000 median and $1,606.06 per square foot, the Seaport commands the highest price tags citywide. However, 62 days on market signals that premium positioning comes with a trade-off: these properties take longer to sell. What it means: Seaport buyers are looking for a lifestyle investment and waterfront access, not a quick flip. Sellers should emphasize amenities and views; pricing competitively relative to newer construction is critical.
South Boston is the volume surprise. With 221 units sold — more than any other neighborhood — South Boston is where buyers with moderate budgets ($880,000 median) find opportunity. The Seaport commands the spotlight, but South Boston’s diverse inventory and 31-day cycle make it the true engine of East Boston demand. What it means: South Boston offers accessibility without sacrificing walkability or community character. Buyers expecting shorter timelines and less bidding pressure than Back Bay will find both here.
South End stability masks neighborhood tiers. At $1,195,000 median and 29 days on market, the South End sits between Back Bay and Beacon Hill in both price and speed. Brownstone conversions and ground-floor retail create distinct micro-markets within the neighborhood. Price-per-square-foot averaging $1,165 is meaningful, but unit-by-unit variance is high. What it means: South End buyers and sellers benefit from strong urban character and proximity to dining and culture, but each property’s exact positioning (block, building type, unit layout) drives individual pricing more than neighborhood averages.
Beacon Hill’s slower cycle reflects premium positioning and inventory dynamics. Fifty-one days on market and $950,000 median place Beacon Hill in a distinct tier: premium pricing with fewer units moving. At $1,303.48 per square foot, Beacon Hill’s price-per-unit is among the highest, narrowing the buyer pool. What it means: Beacon Hill remains deeply desirable, but competition is lower than Back Bay. Sellers can expect a longer marketing period; buyers have more negotiating room than in hot-moving neighborhoods.
Affordable neighborhoods show extended marketing timelines. Allston (77 days), Brighton (35 days), and Roslindale (21 days) represent the lower-price-point entry: $435,000 to $617,350. Longer days on market here reflect lower overall demand velocity and buyer pool size. What it means: Affordability-focused buyers have more leverage and time to shop; sellers in these neighborhoods should expect longer holding periods and may benefit from creative marketing or pricing strategies.
What This Means for Condo Sellers in Back Bay, South End & Beacon Hill
Your advantage is buyer demand. Back Bay, South End, and Beacon Hill together accounted for 436 of the 1,668 total sales — 26% of the entire market — in just six months. Buyers are actively competing for limited inventory in these neighborhoods.
For Back Bay sellers: Price aggressively, highlight updates and systems, and expect multiple offers. The median holding period of 29.5 days is short — make your property photo-ready from day one. Pre-inspection and disclosure transparency will accelerate the process further.
For South End sellers: Emphasize walkability, neighborhood amenities, and unit uniqueness. The brownstone character is your asset; even modest updates (fresh paint, lighting, kitchen) will help your property stand out in a crowded market. South End buyers are culture-focused; highlight proximity to restaurants, galleries, and nightlife.
For Beacon Hill sellers: Patience pays. Your 51-day average gives you room to wait for the right buyer. Position your property as a lifestyle choice, not just an investment. Historic details, water views, or proximity to the Common are unique selling points that can command premium pricing relative to square footage.
Across all three neighborhoods: Condo fees matter more than ever. Buyers scrutinize HOA financials and special assessments. If you’re operating at a deficit or planning major capital work, disclose proactively and have financial reserves documented.
What This Means for Condo Buyers
Boston’s condo market rewards speed and preparation. With an average of 29–35 days on market in premium neighborhoods, delays cost you opportunities.
Get pre-approved before you start touring. It’s table stakes in Back Bay and South End. Sellers will not negotiate with an unqualified buyer when another offer is coming tomorrow.
Understand your neighborhood’s price-per-square-foot baseline. Back Bay is $1,341.61/sqft; South End is $1,165/sqft; Jamaica Plain is $640.20/sqft. Use these benchmarks to evaluate whether a listing is priced competitively. Outliers exist for reasons — find out what they are before making an offer.
Factor in condo fees as part of your monthly housing cost. A $1 million condo with a $600/month fee is not the same as a $1 million condo with a $300/month fee. Over 10 years, that difference is $36,000.
Shorter-market neighborhoods (Charlestown, Roslindale, Jamaica Plain) give you negotiating room. Sellers have fewer competing offers; you can take time to inspect, appraise, and finalize financing without racing against five other buyers.
Higher-price neighborhoods (Seaport, Midtown, Waterfront) favor patience. These properties sit longer, which means you have more time to decide. Don’t rush; you’ll likely find a motivated seller after 45+ days.
October 2026 Outlook
Fall is inventory release season, and the Boston condo market is responding predictably: steady supply meeting steady demand, with no dramatic shifts in either direction. Days-on-market metrics are holding flat across premium neighborhoods, which suggests pricing has found equilibrium. Interest rates remain the wild card — any upward pressure will extend timelines; any downward move will compress them instantly.
Seasonal dynamics favor sellers who list now through November; holiday supply typically drops sharply in December. For buyers, the window to move without extreme competition is closing, but fall is still the most favorable season for negotiation leverage.
If you’re considering a move — whether you’re selling, buying, or upgrading — now is the time to connect with the Charles King Group and understand your specific neighborhood’s rhythms. We live and work in these communities and track these dynamics month by month.
Frequently Asked Questions
How long do condos typically stay on the market in Back Bay?
Back Bay condos sell in a median of 29.5 days (April–October 2026, MLSPIN data). This is the second-fastest cycle in the city and reflects strong buyer demand. Charlestown is faster at 17 days, but Back Bay’s high volume and consistent transaction flow make it the benchmark for urban prime real estate.
What’s a realistic price for a condo in the South End right now?
The median sale price in the South End is $1,195,000 (April–October 2026, MLSPIN data). However, South End prices vary significantly by building type and exact location. Brownstone conversions often command premium pricing; conversions in walk-up buildings may sit below median. Budget between $1,000,000 and $1,400,000 for a quality unit, and factor in condo fees ranging from $300–$800/month depending on building and amenities.
Is Charlestown still a good investment if it’s selling so fast?
Charlestown’s 17-day median days-on-market reflects strong demand and limited inventory—not a warning sign. At $937,500 median, the neighborhood remains affordable relative to Back Bay and offers genuine walkability and community character. If you’re buying for lifestyle and equity appreciation, Charlestown is a solid market. If you’re buying with the expectation of rapid flipping, understand that “fast selling” reflects demand, not price appreciation.
Should I be concerned about buying a condo in a slower-moving neighborhood like Beacon Hill?
No. Beacon Hill’s 51-day average reflects a smaller buyer pool and premium positioning—not a declining market. At $950,000 median and $1,303.48/sqft, Beacon Hill prices are holding steady. Slower timelines actually give you more negotiating leverage as a buyer. If you love Beacon Hill’s historic character and walkability, the extended sales cycle is a feature, not a bug.
What’s the difference between South Boston and the Seaport, and which should I target?
South Boston (221 units sold, $880,000 median) is volume-driven and accessible. The Seaport (35 units sold, $1,626,000 median) is lifestyle-focused and waterfront-premium. South Boston offers neighborhood diversity, local restaurants, and a shorter commute feel; the Seaport offers architectural drama and water views at 85% higher median price. Choose based on budget and lifestyle priority, not investment potential—both markets are performing well.
Is it a good time to sell a condo in Boston right now?
Yes, if you’re in Back Bay, Charlestown, or South End—neighborhoods with strong 17–30 day cycles and active buyer competition. If you’re in a slower-moving neighborhood like Beacon Hill or Allston, you should plan for a 45–75 day timeline and price competitively. Overall, the market is balanced: not a seller’s market, but not a buyer’s market either. Timing depends on your specific property and neighborhood, not the city-wide trend.
All data sourced from MLSPIN. Condominium sales, April 14 – October 14, 2026.
Published by the Charles King Group, Hingham, MA.
Charles King Group is a top-producing real estate team serving the South Shore (Hingham, Cohasset, Scituate, Norwell, Hanover, and surrounding towns), Boston, Cape Cod, Metro West, Northern Middlesex & the Merrimack Valley, and Bristol County. Brokered by Real Broker MA, LLC. Ranked in the top 1.5% of agents nationwide by Real Trends.