


Boston Condominium Market Update: Spring to Fall 2025

Charles King
Charles King is a top-producing real estate agent in Hingham, MA and a trusted Realtor serving the South Shore of Massachusetts, including Hanover, Hu...
Charles King is a top-producing real estate agent in Hingham, MA and a trusted Realtor serving the South Shore of Massachusetts, including Hanover, Hu...
The Boston condominium market has been active over the past six months, with trends showing both neighborhood-specific strength and signs of market balance. Between March 9, 2025 and September 9, 2025, hundreds of units traded across the city, offering valuable insight for buyers, sellers, and investors. Below, we break down the key takeaways from this mid-2025 report.
Overall Market Highlights
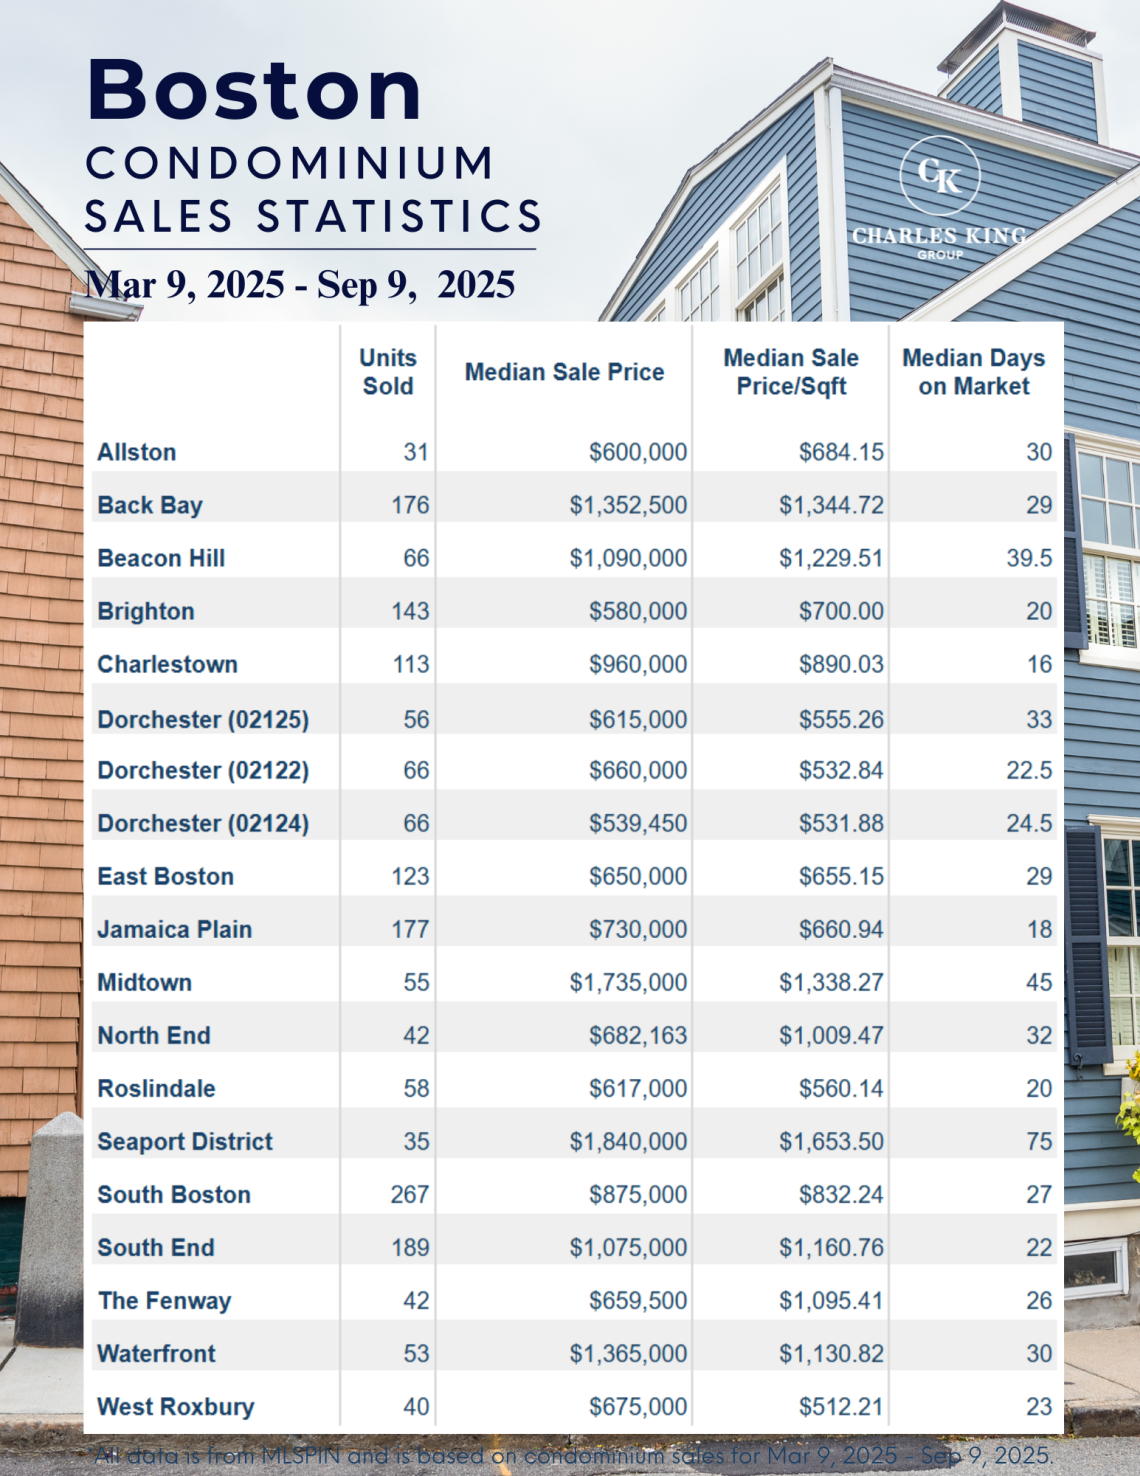
High-demand neighborhoods like the Back Bay, South End, and South Boston continue to see strong sales volumes, each recording over 175 transactions during this period.
Luxury markets such as Midtown, the Seaport District, and the Waterfront lead the city in median prices, with Midtown reaching a $1.73M median and the Seaport topping the list at $1,840,000.
Affordability pockets remain in areas like Brighton ($580,000 median), Dorchester ($539,450 – $660,000 median depending on zip code), and Roslindale ($617,000 median).
Price Trends by Neighborhood
Back Bay: 176 condos sold at a median price of $1,352,500 and an impressive $1,344 per sq. ft. Back Bay remains a gold standard for luxury buyers.
South Boston: The city’s most active condo market, with 267 units sold at a median of $875,000, highlighting its popularity for young professionals and investors.
Seaport District: Small in volume (35 sales) but dominant in pricing, commanding the highest median price per sq. ft. at $1,653.50.
Jamaica Plain & Roslindale: Offering relative affordability with medians of $730,000 and $617,000, while still benefiting from easy access to downtown.
Dorchester: Consistent demand across its zip codes, ranging from $531–$555 per sq. ft., providing opportunities for first-time buyers and investors seeking value.
Days on Market (Speed of Sales)
Fastest moving markets: Charlestown (16 days), Jamaica Plain (18 days), and Roslindale (20 days) — showing strong buyer demand in these communities.
Longest times to sell: Seaport District (75 days) and Midtown (45 days), reflecting the higher price point and selective buyer pool in Boston’s luxury segment.
Balanced pace: Most neighborhoods averaged 25–35 days on market, signaling a healthier balance between buyers and sellers compared to the hyper-competitive markets of past years.
What This Means for Buyers and Sellers
For Buyers: There are clear entry points in neighborhoods like Brighton, Dorchester, and Roslindale where values remain accessible. But competition is still fierce in mid-range markets like Jamaica Plain and Charlestown, where properties sell quickly.
For Sellers: Luxury owners in areas like the Seaport or Midtown need patience and proper marketing to connect with qualified buyers. Meanwhile, sellers in South Boston, South End, and Charlestown should expect steady activity and shorter market times when priced correctly.
The Bottom Line
Boston’s condo market remains diverse, offering something for every type of buyer — from affordable starter condos to high-end luxury residences. Whether you’re looking to buy, sell, or invest, understanding neighborhood-level data is key to making smart decisions.
 Thinking about making a move in Boston? Our team at The Charles King Group specializes in guiding clients through this competitive market. Reach out today for a customized strategy tailored to your goals.