


Scituate, MA Single-Family Home Sales Analysis (2021–2025)

Charles King
Charles King is a top-producing real estate agent in Hingham, MA and a trusted Realtor serving the South Shore of Massachusetts, including Hanover, Hu...
Charles King is a top-producing real estate agent in Hingham, MA and a trusted Realtor serving the South Shore of Massachusetts, including Hanover, Hu...
This report analyzes single-family home sales in Scituate, Massachusetts from 2021 through 2025, using the provided annual sales data. Key metrics include median sale prices, number of homes sold, average days on market, and the distribution of sale prices into defined price brackets. The following sections present year-by-year trends with supporting tables and charts, along with a narrative of notable changes over time.
Median Sales Price Trends (2021–2025)
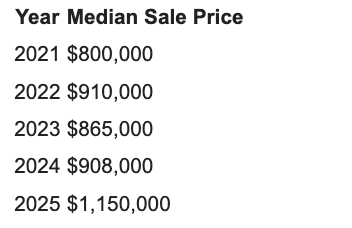
Median Sale Price: The median sale price for single-family homes in Scituate rose substantially over the 5-year period. In 2021, the median price was around $800,000. This climbed to approximately $910,000 in 2022, reflecting the intense homebuyer demand during that period. After a slight dip in 2023 (median about $865,000), prices rebounded in 2024 to roughly $908,000. By 2025, the median sale price jumped to $1,150,000, the highest in the period (based on sales through September 2025). Overall, Scituate’s median home price increased by about 44% from 2021 to 2025. This steady upward trend indicates strong appreciation in home values, with 2022 and especially 2025 marking significant price gains.
Median Sale Price by Year (USD)
Median prices rose year-over-year, with a notable surge in 2022 and again in 2025. The early spike between 2021 and 2022 suggests an overheated market likely fueled by high demand and limited supply post-2020. The slight pullback in 2023 may reflect market stabilization or rising interest rates tempering prices, but 2024’s rebound and 2025’s sharp increase signal that pricing momentum continued upward. In practical terms, homebuyers in 2025 were paying hundreds of thousands more for the typical house than they did in 2021. For example, 2021 saw multiple homes selling around the $800K range, whereas by 2025 even the median-priced home was about $1.15M.
Annual Home Sales Volume
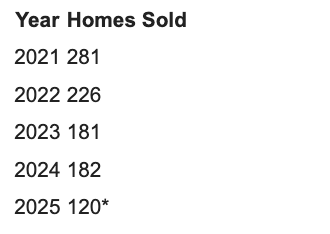
Number of Homes Sold: The volume of single-family home sales in Scituate declined each year from 2021 through 2023, before leveling off. 2021 had the highest sales count with 281 homes sold, reflecting a very active market. Sales dropped to 226 homes in 2022, and then to 181 in 2023. In 2024, 182 homes were sold – essentially flat compared to 2023, suggesting the market found a new equilibrium. The data for 2025 (120 sales) is year-to-date through mid-September; extrapolating to year-end, 2025 is on track to finish with fewer sales than 2024. This represents a significant contraction in annual sales volume (~35% fewer sales in 2024 than 2021, and likely even fewer in 2025). The shrinking number of transactions after 2021 may indicate cooling demand or tighter supply (fewer listings), possibly due to rising interest rates or buyer fatigue after the 2020–2021 surge.
Number of Single-Family Homes Sold
*(2025 figure is for Jan–Sep 2025; full-year 2025 sales will likely be slightly higher.)
The year 2021 stands out as an unusually high-volume year for home sales. The drop in 2022 and 2023 indicates the market slowed down from that peak. By 2024, sales volume stabilized at a lower level. The partial 2025 data suggests continued low turnover. Fewer sales in recent years can be attributed to factors like limited inventory and higher borrowing costs, which tend to reduce the number of transactions. In summary, the market went from frenetic in 2021 to much quieter by 2023–2025, with only about two-thirds the number of yearly sales in 2024 compared to 2021.
Average Days on Market
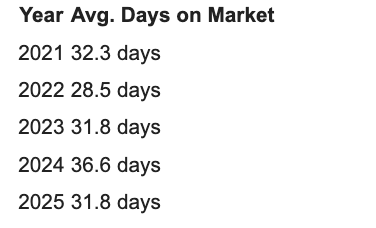
Average Days on Market (DOM): The pace of home sales, as measured by average days on market, fluctuated over the period. In 2021, homes sold in about 32 days on average, indicating relatively quick sales. 2022 saw the fastest market, with an average DOM of only 28 days, suggesting many homes were snatched up almost as soon as they were listed during that hot market year. However, by 2023 the average DOM increased to ~32 days, and in 2024 it rose further to about 37 days, implying that homes took over a week longer to sell on average than they did in 2022. So far in 2025, the average DOM is around 32 days, a slight improvement from 2024, potentially signifying that well-priced homes are still finding buyers in a reasonable timeframe. The overall trend from 2022 to 2024 was a lengthening of time on market, consistent with a cooling market where buyers are more cautious and homes don’t move as instantly as during the 2021–2022 boom.
Average Days on Market
From 2021 to 2022, the already brisk selling tempo quickened even further – many listings in 2022 went under agreement in just 2–3 weeks on average. This aligns with anecdotes of bidding wars and homes often selling in days during that period. The slowdown in 2023 and 2024 (averaging about 4–5 weeks on market) suggests buyers had more leverage or hesitancy, and some listings took longer to find the right buyer. By 2025, the market time appears to have normalized closer to a one-month average, which is still relatively fast historically. The spike in 2024’s DOM (the highest of the five years) is a notable contrast to 2022’s low DOM, highlighting how the market transitioned from extremely fast sales to a more balanced pace.
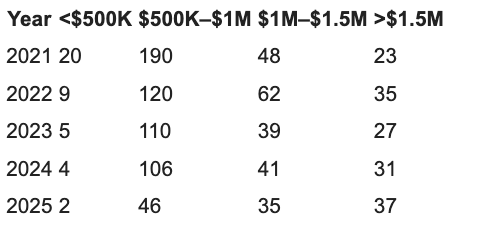
Price Distribution by Category
An important trend is how the distribution of sale prices shifted dramatically upward between 2021 and 2025. The table below breaks down the number of homes sold each year into four price brackets: entry-level (<$500K), mid-range ($500K–$1M), upper-mid ($1M–$1.5M), and luxury (> $1.5M).
Number of Homes Sold
by Price Range
Shifting Price Bands: In 2021, the vast majority of sales (over two-thirds) were in the $500K–$1M range, and there were still about 20 homes (7% of sales) that sold for less than $500K. By contrast, lower-priced sales have almost vanished by 2025 – only 2 homes sold for under $500K in the first nine months of 2025. This reflects rising home prices pushing most properties into higher price tiers. The $500K–$1M bracket, which accounted for 190 sales in 2021, shrank to just 46 sales in 2025 (YTD), dropping from 68% of transactions to roughly 38% of transactions. Meanwhile, the number of $1M+ sales soared. Homes selling between $1M and $1.5M roughly doubled their share: 48 sales in 2021 grew to 35 in 2025 (which is ~29% of the smaller 2025 sales pool, up from 17% in 2021). Most striking is the increase in luxury sales over $1.5M – these went from 23 homes in 2021 (8% of sales) to 37 homes by Sept 2025 (over 30% of sales). In fact, by 2025 the >$1.5M category represents the largest chunk of sales, roughly equal to the $500K–$1M group in absolute count despite the overall market slowdown.
This upward shift in price distribution indicates that home values in Scituate have appreciated enough to lift many properties into higher pricing brackets. In 2021, it was still common to find homes under $500K, and only a few high-end properties exceeded $1.5M. By 2025, virtually every sale is above $500K, and a significant portion are luxury homes above $1.5M, with multiple sales well into the $1M–$2M range. The presence of a $4.4M sale in 2021 and several $3M–$4M sales in 2022 show there were exceptional high-end transactions early on, but those were outliers. The more telling trend is the vanishing of low-end sales and the normalization of million-dollar transactions. By 2025, over half of all single-family homes in Scituate were selling for above $1M, compared to roughly one-quarter of sales in 2021 – a dramatic change in the market profile.
Year-over-Year Trends and Key Insights
Combining these metrics, a clear narrative emerges for Scituate’s single-family housing market from 2021 to 2025:
Home prices climbed rapidly: Median prices increased year-over-year, with a total jump of about $350K from 2021 to 2025. The appreciation was especially pronounced in 2022 and 2025, indicating periods of accelerated price growth. Even accounting for a slight dip in 2023, prices in 2025 are significantly higher than in 2021, showing a strong sellers’ market over the period.
Sales volume declined after 2021: The number of transactions peaked in 2021 and then fell sharply in 2022 and 2023. The fact that 2024’s sales were roughly equal to 2023 suggests the market found a new, lower steady state for activity. Fewer homes changing hands could be due to limited inventory or buyers being priced out. The partial 2025 data continues this low volume trend, pointing to a quieter market compared to the frenzy of 2021.
Market competition eased slightly: Average days on market data shows that homes were selling extremely fast in 2021–2022, then began taking longer to sell in 2023–2024. This implies a shift from a blazing-hot market to a more balanced one where buyers had more time and choice. By 2024, some listings required over a month on market on average, compared to just 4 weeks or less in 2021–2022. The 2025 data hints that while homes still sell in about a month (fairly quickly), the ultra-competitive bidding wars of the early pandemic boom have cooled.
Market moved to higher price tiers: Perhaps the most notable change is the transformation in price distribution. Entry-level sales under $500K largely disappeared by 2025, and mid-priced sales ($500K–$1M) also became fewer. In 2021, about 75% of homes sold for under $1M; by 2025, roughly 60% sold above $1M. The proportion of high-end sales (> $1.5M) roughly quadrupled, reflecting both rising home values and an increase in luxury properties changing hands. In short, the typical Scituate home sale has shifted from the mid-$600K-$800K range in 2021 to well over $1M by 2025.
In conclusion, the 2021–2025 period in Scituate was characterized by surging prices and a shift toward higher-end market activity, but with reduced sales volume and a slight relaxation of the frantic pace seen in 2021–2022. Homeowners who sold in 2025 generally achieved far higher prices than those in 2021, albeit amidst a market with fewer transactions. Buyers, on the other hand, faced a markedly more expensive market in 2025 and slightly more breathing room in terms of purchase decisions compared to the height of the boom. These trends highlight a significant transformation of the local housing landscape in just a few years, with Scituate’s market maturing into a higher price bracket while stabilizing from the volatility of the early 2020s.
Explore Scituate’s shift into higher price tiers...
and connect with our team to identify opportunities.